What to take away
- Choose the business outcome before choosing the test.
- Separate observed problems, hypotheses and measured results.
- Give every experiment a decision rule and a place to record what happened.
Start with the decision you need to make
A CRO roadmap is a sequence of questions about the customer journey, with evidence, an owner and a way to judge the answer. It is useful when it helps a team decide what to investigate, build and measure next. A long list of button colours is a backlog, but it does not yet explain why the work deserves priority.
Start with one business question. An e-commerce team might ask whether product information is preventing first-time visitors from buying. A service business might ask why apparently qualified enquiries do not become attended appointments. Those questions point to different evidence and different designs.
Write the decision in plain language: “We need to decide whether to explain delivery before the purchase action.” Keep it narrow enough that the answer changes what you build. “Improve the user experience” is a useful ambition, but it cannot tell a team whether a particular experiment answered its question.
Choose the outcome, then the guardrails
Define the main metric, its denominator and the reporting window before looking at results. Revenue per eligible visitor answers a different question from checkout completion among people who already started checkout. Mixing the two can make a design appear successful simply because the audience changed.
Choose guardrails that reveal an unacceptable trade-off. A higher order rate may be less useful if refunds increase or contribution margin falls. More form submissions may be less useful if the team cannot contact them. Record what your team would do if the primary metric improves while a guardrail worsens.
Scroll across to compare the columns
| Business question | Possible primary metric | Useful guardrail |
|---|---|---|
| Are product decisions easier? | Revenue per eligible visitor | Refunds or margin per order |
| Is the booking journey clearer? | Attended appointments per eligible enquiry | Cancellation rate or team workload |
| Does the page attract the right enquiry? | Qualified enquiries per visitor | Qualification rate and cost per qualified enquiry |
These are examples to choose from, not universal targets. Use the metric you can collect reliably and reconcile with the business. A metric that changes definition halfway through a test cannot support a clean comparison.
Collect evidence before collecting ideas
Combine journey data with customer context. Funnel reports can show where an issue is concentrated. Support conversations, on-site feedback and usability sessions can help explain what people misunderstand. Check the mobile experience directly, including the actual route from ad click to confirmation.
Keep observations separate from explanations. “Visitors repeatedly reopen the size guide” is an observation. “The sizing advice is unclear” is one possible explanation. A useful follow-up might compare the wording with the questions customers actually ask, instead of immediately redesigning the whole page.
Turn the finding into a testable hypothesis
Use a short brief: for this audience, at this point in the journey, we observed this problem. We believe this change could help because of this evidence. We will evaluate it with this metric and these guardrails. This makes the reasoning available to the designer, developer and analyst.
For example: “New customers ask whether the item will arrive before their event. We will show the delivery estimate beside the purchase action because the current answer is separated from the decision.” That is an illustrative hypothesis. It still needs evidence from your own customers and a technically reliable delivery estimate.
- Name the audience and the page or step being changed.
- Attach the observation and its source, including the time period.
- Describe the smallest change that tests the explanation.
- Define the main metric, guardrails and implementation checks.
- Assign the owner and the decision that follows the result.
Prioritise the next useful answer
Compare opportunities by the strength of the evidence, the importance of the affected decision, the reachable audience and the effort required. A simple score can make discussion easier, but it should not turn an unsupported idea into a precise financial forecast. Keep the reasoning beside the number.
Some issues need a repair rather than an experiment. A broken submission button or unreadable error message does not need to beat a control to deserve attention. Other issues need more research. If you cannot explain why customers struggle, running variants may simply produce an expensive inconclusive result.
Scroll across to compare the columns
| Evidence and hypothesis | Measure and feasibility | Owner and next decision |
|---|---|---|
| Illustrative example: support questions suggest delivery timing is unclear. Test a location-aware estimate beside the purchase action. | Primary: completed orders per eligible visitor. Guardrail: delivery-related support contacts. First confirm the estimate is reliable and the test has enough eligible traffic. | Store team owns the estimate; analyst owns the test check. If results are reliable and the guardrail holds, decide whether to keep the change. Otherwise investigate or revise. |
An A/B test also needs enough suitable traffic for the effect you want to detect. Plan sample size, allocation and analysis before launch, and use an appropriate statistical method. Do not stop solely because a dashboard briefly shows a favourable result. If the required run is impractical, consider usability research or a narrower question before promising a testing cadence.
Use a scenario to understand scale
The calculator below holds traffic and average order value constant so you can inspect one assumption at a time. A change from 2% to 2.5% is a 0.5 percentage-point difference, or a 25% relative change. Neither number is a prediction that your design will achieve it.
Model the opportunity
Change the assumptions to see the arithmetic. Use the same currency for order value and revenue.
Scenario, not a forecast. This excludes refunds, tax, margin, capacity and changes in traffic quality. It does not establish statistical significance. Inputs stay in your browser.
Use the result to discuss whether the question could matter enough to investigate. Then compare the scenario with the cost of implementation, margin and operational constraints. Do not paste this arithmetic into a client case study as measured revenue.
Make the result useful, including when it is inconclusive
Before launch, verify assignment, tracking, event duplication, page behaviour and the expected balance between variants. Microsoft’s experimentation guidance describes sample ratio mismatch as a data-quality warning. A suspicious allocation deserves investigation before interpreting a lift.
At the planned decision point, record what ran, the eligible audience, the reporting period, uncertainty and guardrail results. Decide whether to keep, change, stop or investigate further. “Inconclusive” is a valid result; it is not evidence that two experiences are identical.
Keep a short learning record next to the next brief. Explain what the result changes about your understanding of the customer. This turns an ongoing CRO programme into accumulated knowledge rather than a monthly production quota.
Check the roadmap before you commit
A roadmap worth running
0 of 7Work through your page. Your progress stays in this browser.
No account needed. Nothing is sent to Convertt.
Sources & further reading
The references behind this guide. Examples and recommendations remain distinct from reported client results.
- Microsoft Research: patterns of trustworthy experimentation
Background on pre-experiment planning and measurement. Our roadmap structure is editorial guidance, not a reproduced Microsoft framework.
- Microsoft Research: diagnosing sample ratio mismatch
Supports checking experiment allocation and investigating data-quality problems before analysing effects.
- Convertt: RemoBrush project
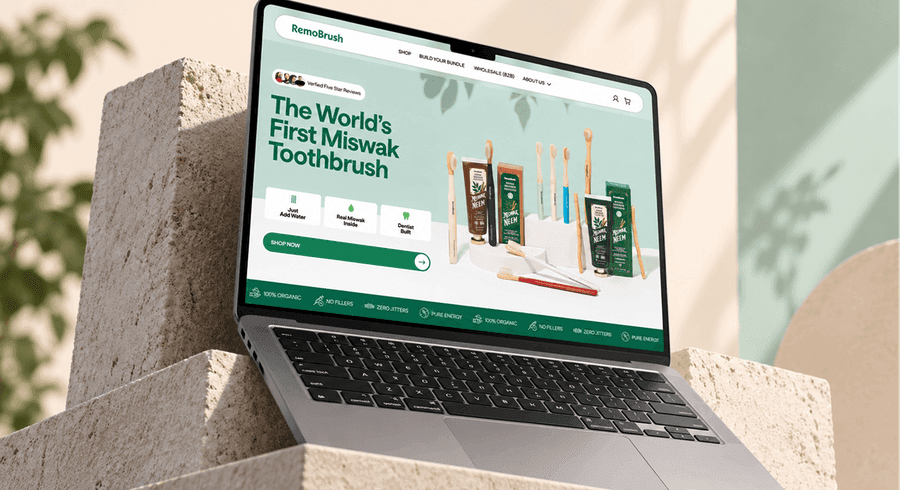
Source of the design example. No conversion uplift or experiment outcome is attributed to the artwork.
What deserves your next experiment?
Explore how Convertt approaches the work, then look at an actual project in detail.